
The Robots Nobody Bought
American firms buy production software everywhere and robots almost nowhere. Two federal surveys show the reason isn't cost, and it isn't nerve. They show where the robots that do exist ended up.

I haven’t written anything here for the last two months. People who follow AI policy in DC religiously would know how many fires there have been that required my attention. I plan to resume a regular cadence of writing here now that we won’t have as much chaos going forward. Wishful thinking I guess, but one can hope.

So now that we’re back to talking about clankers robots, every so often the Census Bureau, working with the National Science Foundation, asks a very large number of American businesses a simple question: which technologies do you actually use to make your product or run your service. Thankfully, they don’t ask about the ones you admire in a keynote but the ones bolted to the floor. The 2023 round of this questionnaire reached 4.9 million firms, and the answers on three technologies sit side by side in a way that I frankly think should trouble anyone who believes this country is busy automating itself.
Specialized software: 32 percent of firms say they use it in production. Specialized equipment: 13 percent. Robots: 1.3 percent. It’s the same survey, same firms, same line in the questionnaire, and really wild gaps. American business bought a lot of software, bought a bunch of machines, and mostly walked past the robots admiring their demos from afar.
The lazy read here would be that we have gone soft on machinery, some cultural flinch in a country that would rather ship code than bend steel bla bla. Fortunately, the survey retires that read on its own page. Firms buying production software at a third are hardly shy of technology, and firms running specialized equipment at one in eight are not particularly squeamish about the heavy, expensive kind. They buy plenty. They just skip the robots. The question worth asking is narrower: why this one technology, alone among the three, keeps getting left in the crate.
See now here is the objection I would raise if I were reading over your shoulder, and the survey hands it to you in black and white. Seven in ten firms say robots are “not applicable to this business.” A robot does nothing for a title company or a dental practice, and the survey is thick with title companies and dental practices. That’s fair. That 71 percent is why the headline number is not the scandal. It is an average, held down by every business a robot was never going to touch. Maybe sometime down the road it would but not today.
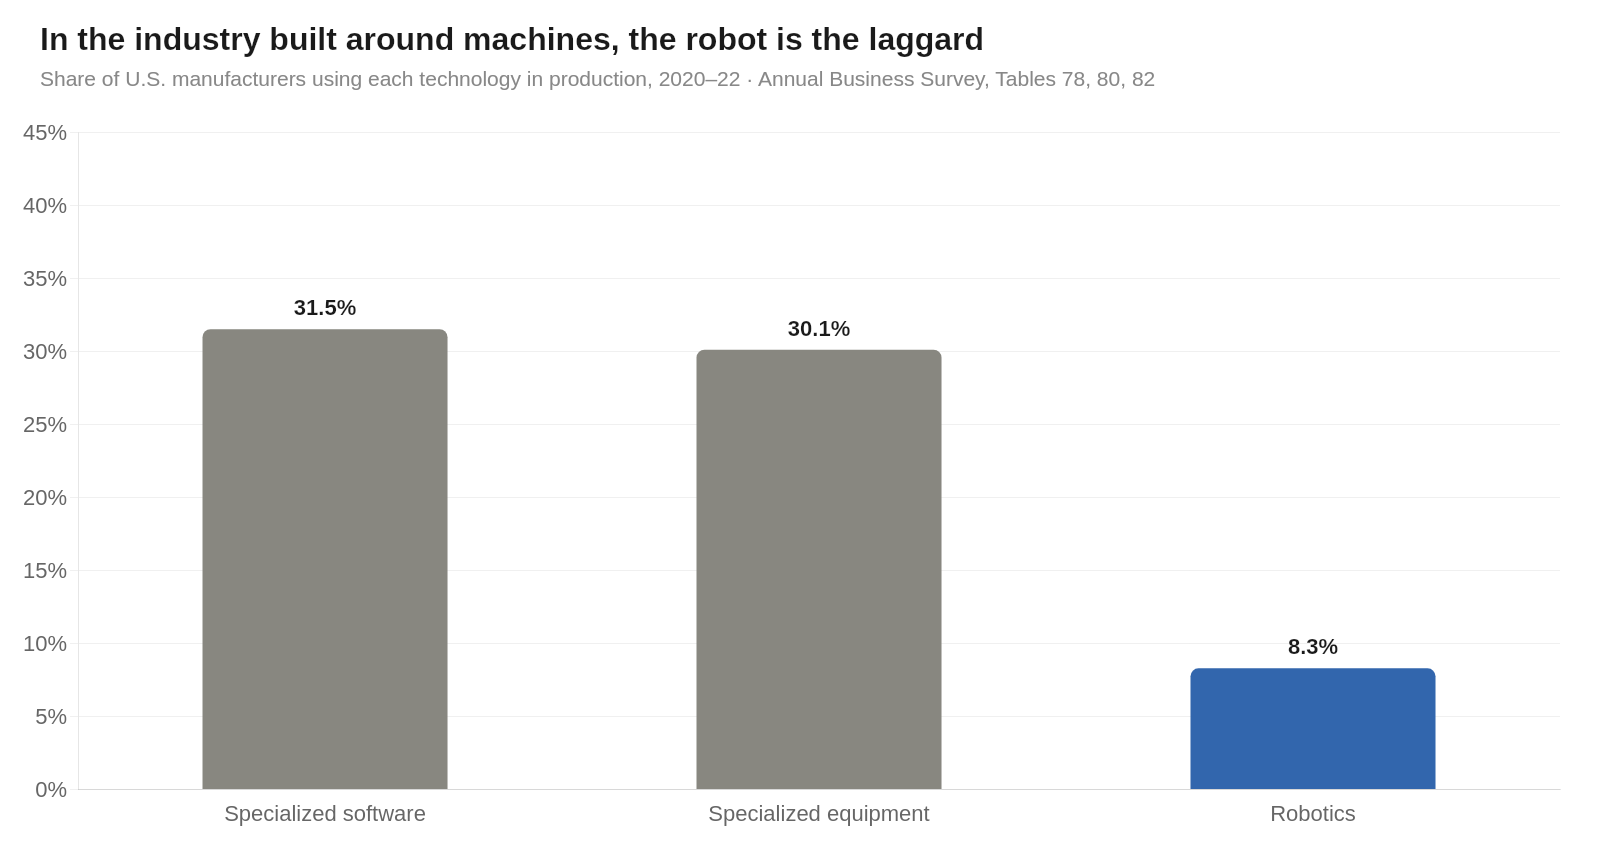
So narrow the field to where no one disputes the point. Manufacturing—metal, plastics, machinery, cars. There robot use runs 8.3 percent, better than the whole economy and still thin for the sector whose entire romance is the arm on the line. Set it beside those same manufacturers’ other tools: again, software at 31 percent, specialized equipment at 30, robots at 8. In the one industry built around machines, the robot trails the others by nearly four to one. And more than half of manufacturers, 55 percent, still file robots under “not applicable,” against about a third who say so of software or equipment.
That 55 percent rewards a second look, because “not applicable” is doing two jobs at once. I think some of it is honest. A shop turning out a hundred different low-volume parts a month has work that today’s robots genuinely cannot do, the fine, contact-rich handling that still defeats them. And some of it is a firm glancing at what it would take to get a robot running on its own floor and quietly filing the whole idea under “not for us.” The survey cannot tell the two apart. Firm size, however, can.
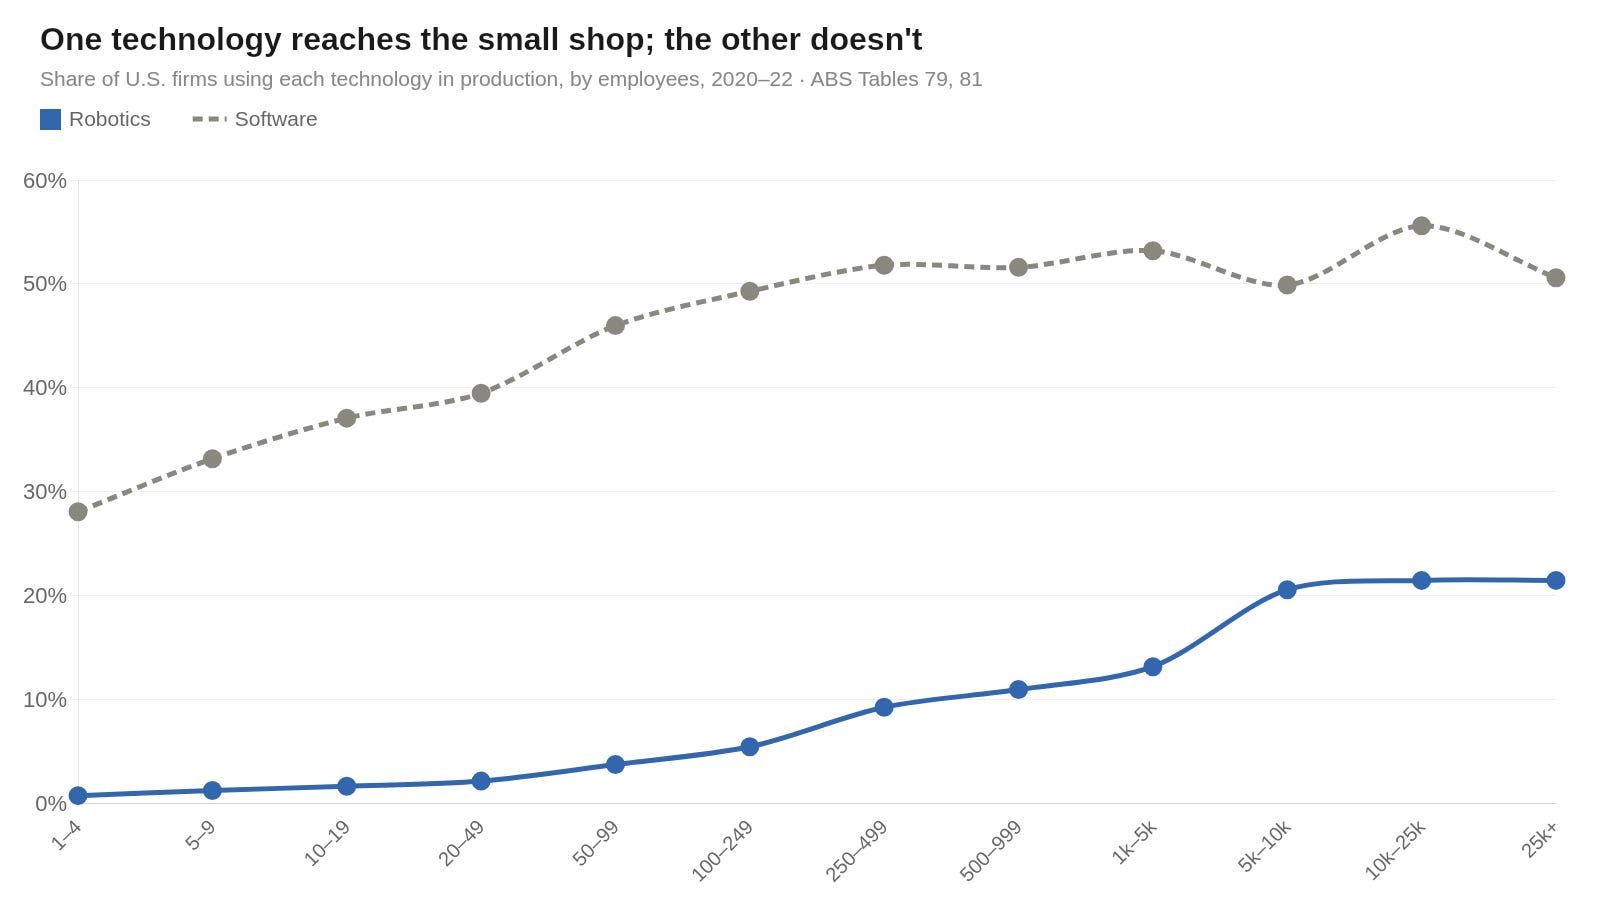
Sort robot use by how many people a company employs and look at how it climbs a wall. Among the smallest firms, one to four people, robots turn up at eight-tenths of a percent. Among the largest, twenty-five thousand and up, at 21.5 — twenty-seven times the rate. And software makes the same climb far more gently: it starts high, near thirty percent even at the four-person shop, and drifts up from there. One technology travels down to the small firm. The other, unfortunately, stays with the giants.
Part of that steepness is composition, since the tiniest firms are mostly dry cleaners and law offices rather than fabricators, so do the honest thing and strip it out. Look only at firms that told the survey robots do apply to their business, and ask how many actually run one.
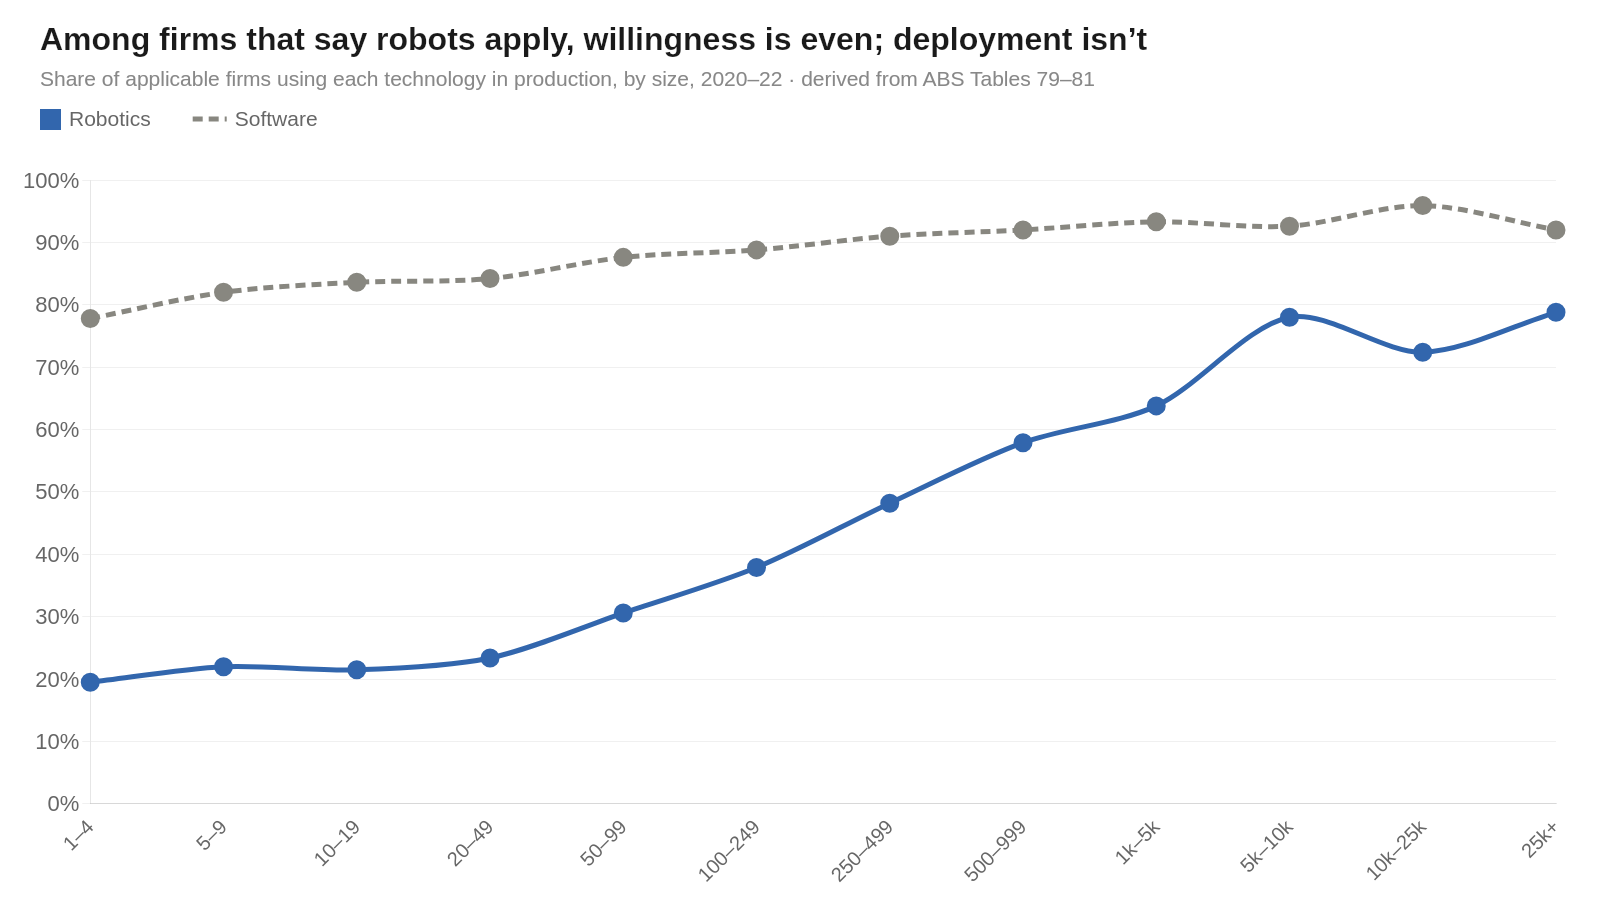
Among the small, about one in five. Among the large, about four in five! Ask the same of software and the needle barely moves: roughly four in five of the small, nine in ten of the large.1 The willingness is there at every size. What differs is who can act on it. Among firms that say both technologies apply to them, the gap between running software and running a robot is almost sixty points at the smallest firms and thirteen at the largest. The penalty for wanting a robot is heaviest on the small shop, and it melts as the firm grows.
The reason is not a mystery once you have watched it happen. A robot shows up as a project wearing the costume of a purchase. Yes you buy the arm, but then you have to pay for everything the brochure leaves out: the fixture that cradles the workpiece at exactly the right angle, the safety cage, the integrator who spends three weeks teaching the machine to find your part, on your bench, under lights that exist in no other building. Software you install. A robot you install into one specific room that resembles no other room. The arm is the cheap part, and a small shop cannot spread the expensive part across enough units to make the arithmetic close.
That is the firm counting itself. I went looking for a second opinion, from a different agency asking a different question. The Economic Census does not survey firms; it walks the floor of manufacturing plants, and it does not ask what a plant uses in production but whether robots are physically present. So different universe, different measure etc etc. If the cliff were an artifact of how the first survey was worded, or of all those dry cleaners at the bottom, it should soften here, in a sample where every establishment makes something.
It does not soften. It is still the same wall.
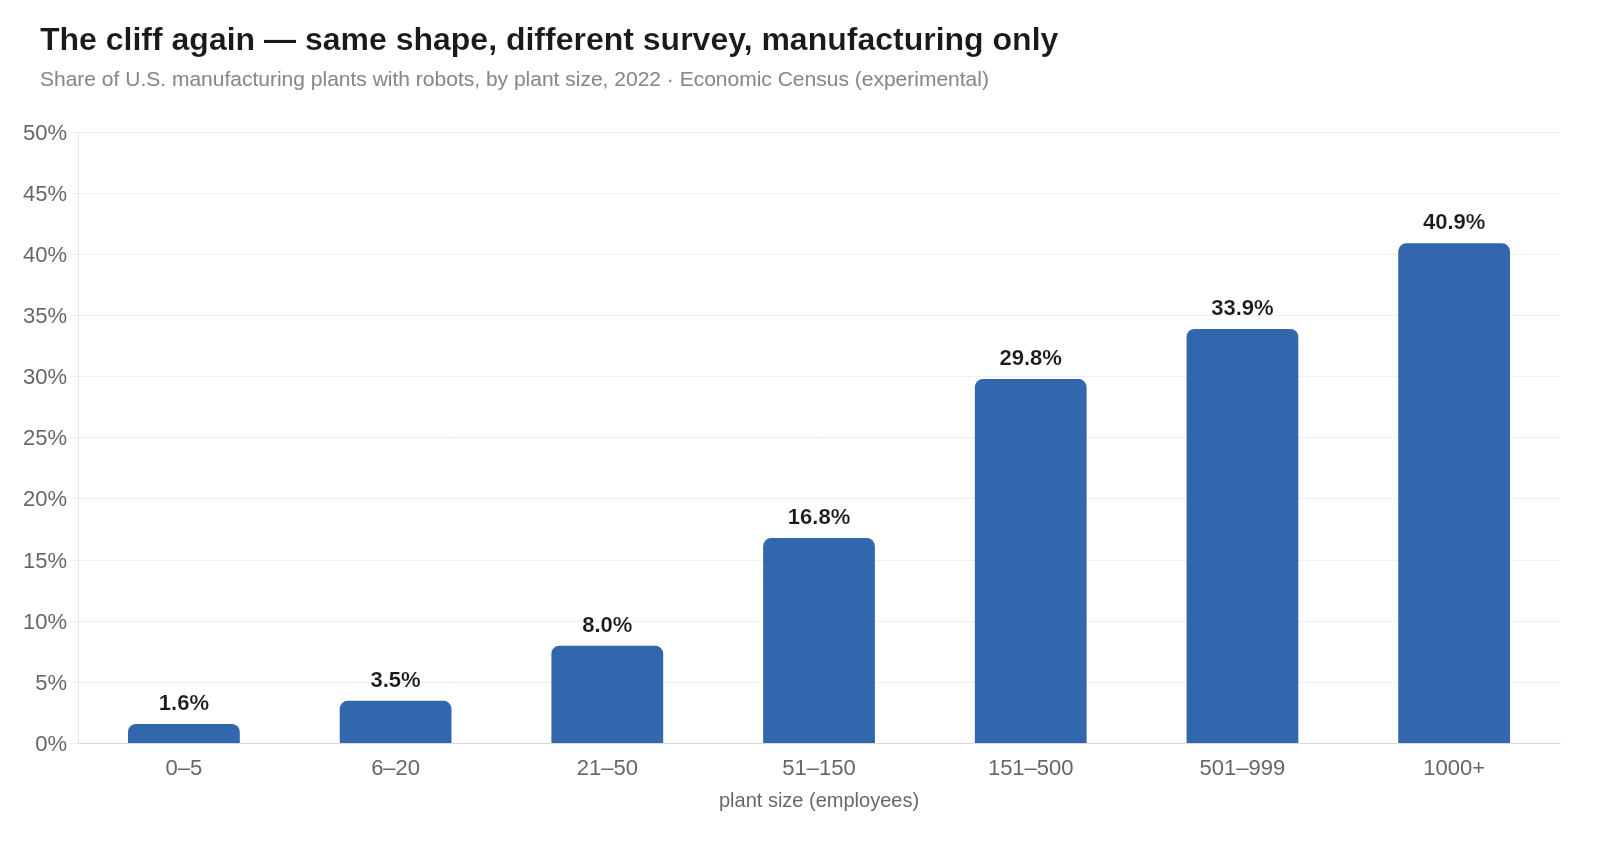
Among the smallest plants, five workers or fewer, robots are present at 1.6 percent. Among plants with a thousand or more, at 41. Every plant in this count makes something, so the composition dodge is gone, and the gradient stands anyway: a firm-level survey of production use and a plant-level census of physical presence, two instruments sharing no methods, all tracing the same curve. I think it’s fair to say that when two independent measurements agree, the thing they are measuring is usually real. What they agree on is that a robot is a large-establishment technology, for the reason the arithmetic already gave. Below a certain scale, the integration cost, unfortunately, has nowhere to land.
The Census also sees something the firm survey cannot. Because it counts plants and the workers inside them, it can show not just how many factories have robots but how much of the workforce actually stands near one. Nationally, 6.4 percent of manufacturing plants have a robot, and those plants employ a quarter of all manufacturing workers. The robots pile into the big rooms, and the big rooms hold most of the people. That concentration has a geography.
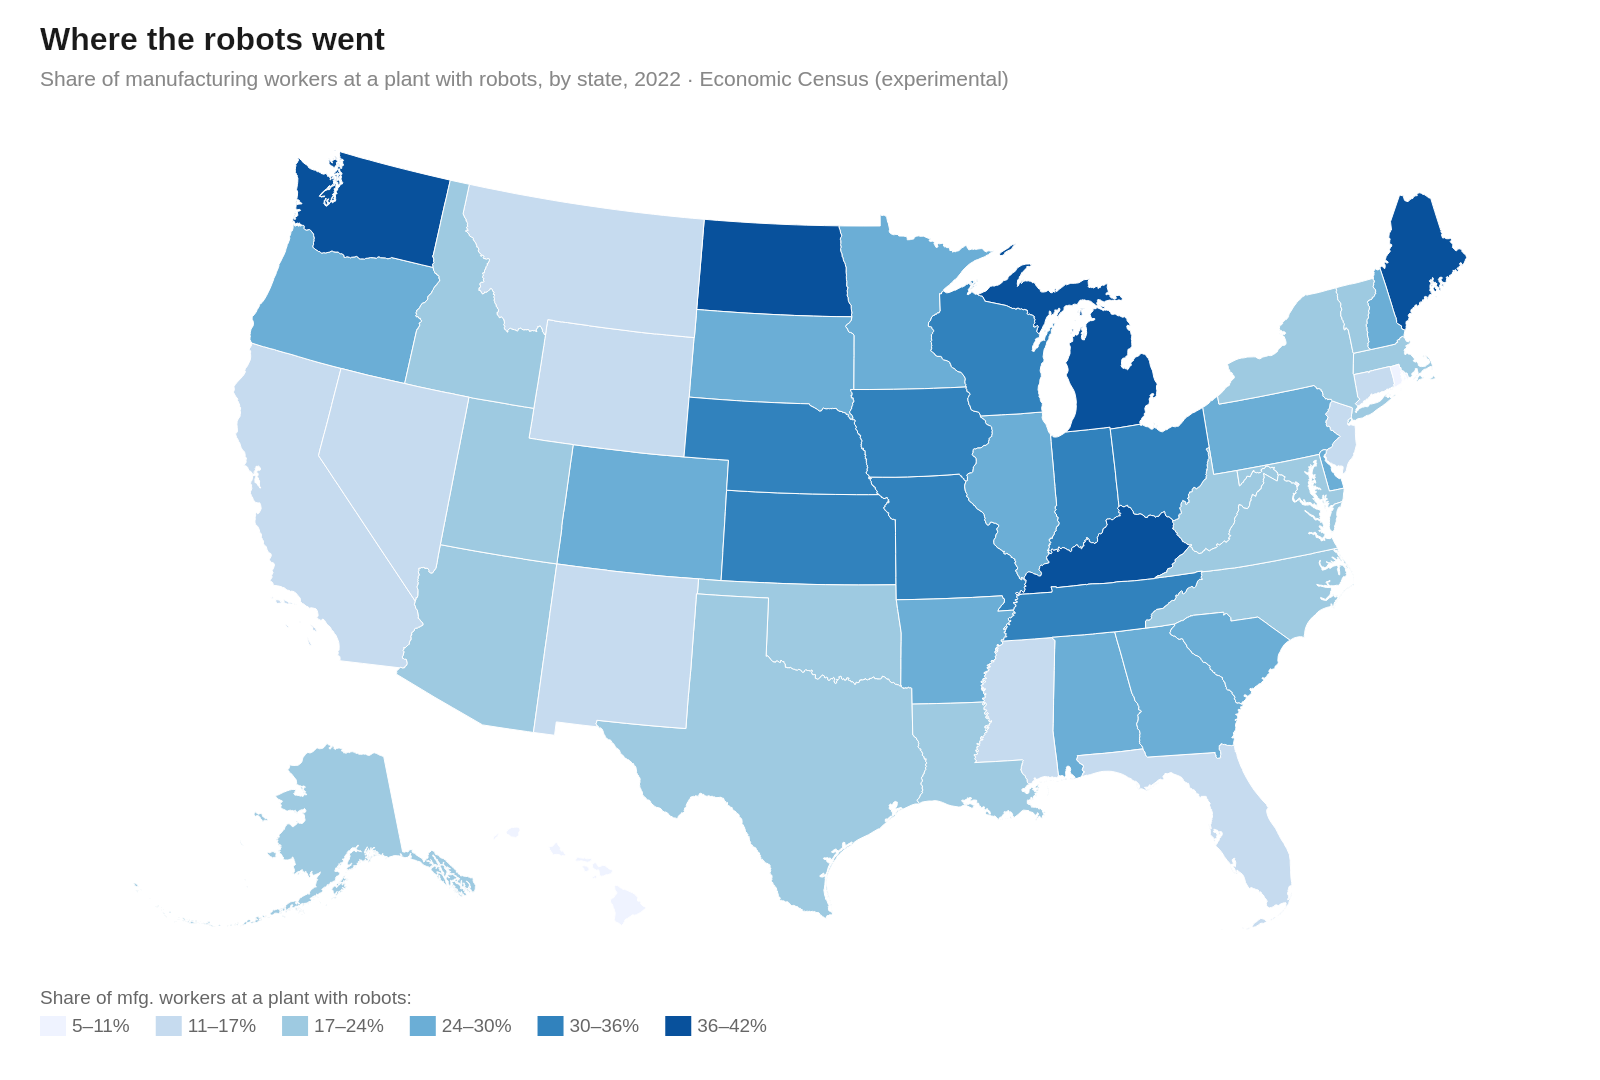
The map is a portrait of heavy industry. Michigan leads (which should be fairly obvious): two in five of its manufacturing workers are at a plant with robots, with Kentucky just behind, then the auto-and-machinery corridor and the upper-Midwest belt of metal, food, and farm equipment—Ohio, Wisconsin, Iowa, Indiana, Missouri, Kansas, the Dakotas. The coasts and the service and apparel economies run pale, Rhode Island and New Jersey down in the low teens, Hawaii and the District barely above five percent. So instead of spreading across the country, the robots really settled where the heavy plants already were.
The dollars settled with them, though not quite where you would guess.
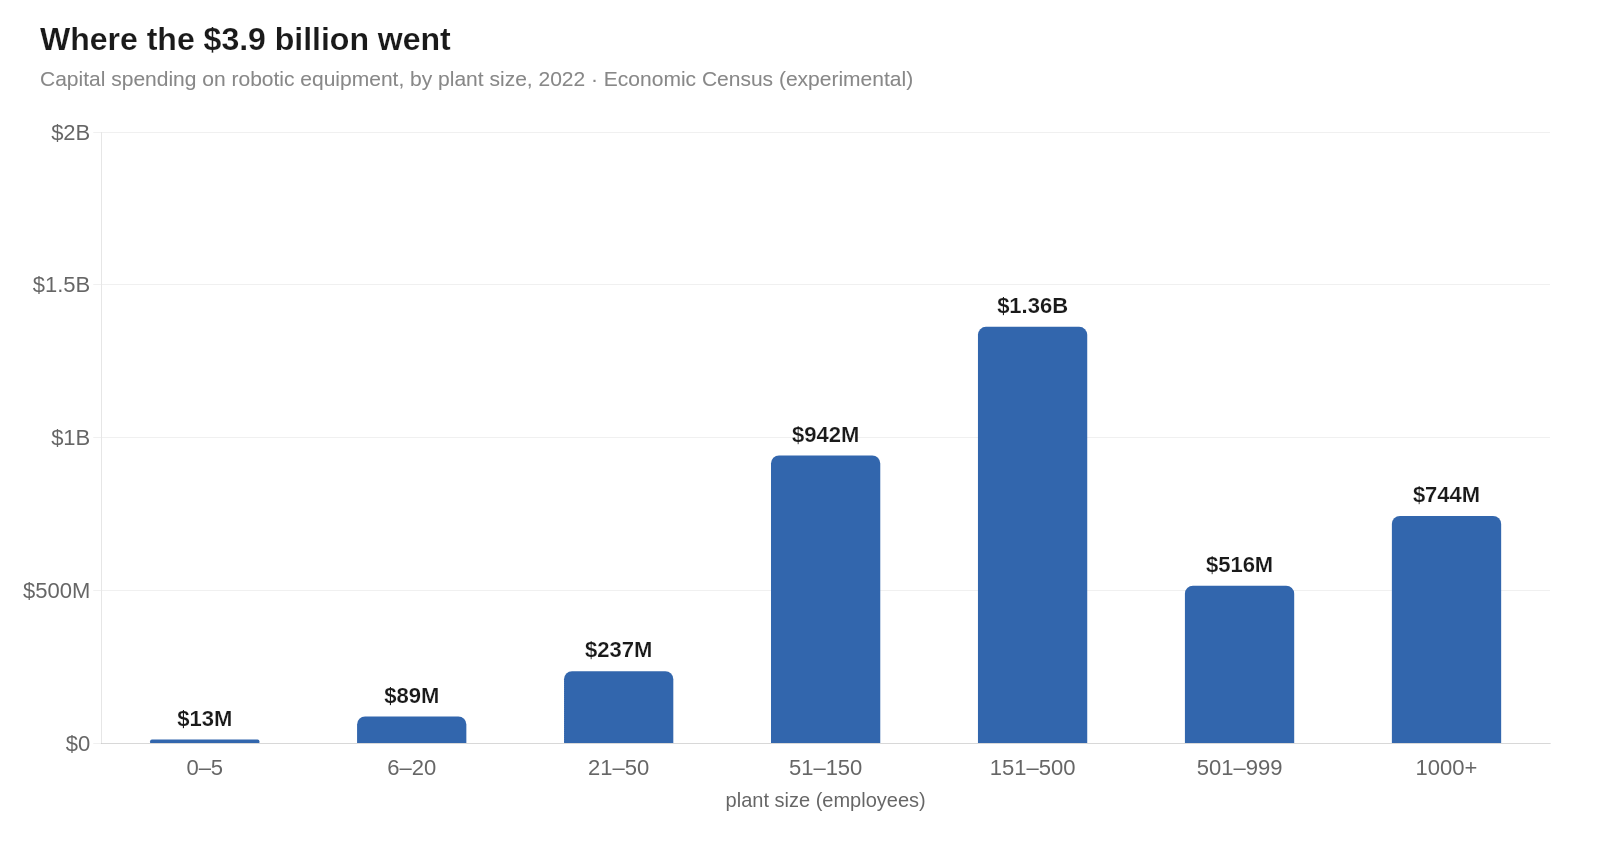
Manufacturers spent 3.9 billion dollars on robotic equipment in a single year, and the money does not pool at the giants. It interestingly peaks in the plant of one to five hundred workers, 1.4 billion dollars, better than a third of the national total, with the mid-large band holding close to sixty percent. The very largest plants adopt at the highest rate, but only about two in a hundred robot-adopting plants are that large, too few to carry the spend. The investment mass sits in the upper-middle of the size distribution: plants big enough to swallow an integration project, common enough to add up. This is the cliff again, now with a price on it. The threshold is very real, and it costs real money to cross.
One industry has crossed it wholesale, and it is worth naming, because it sits so far out ahead of the rest.
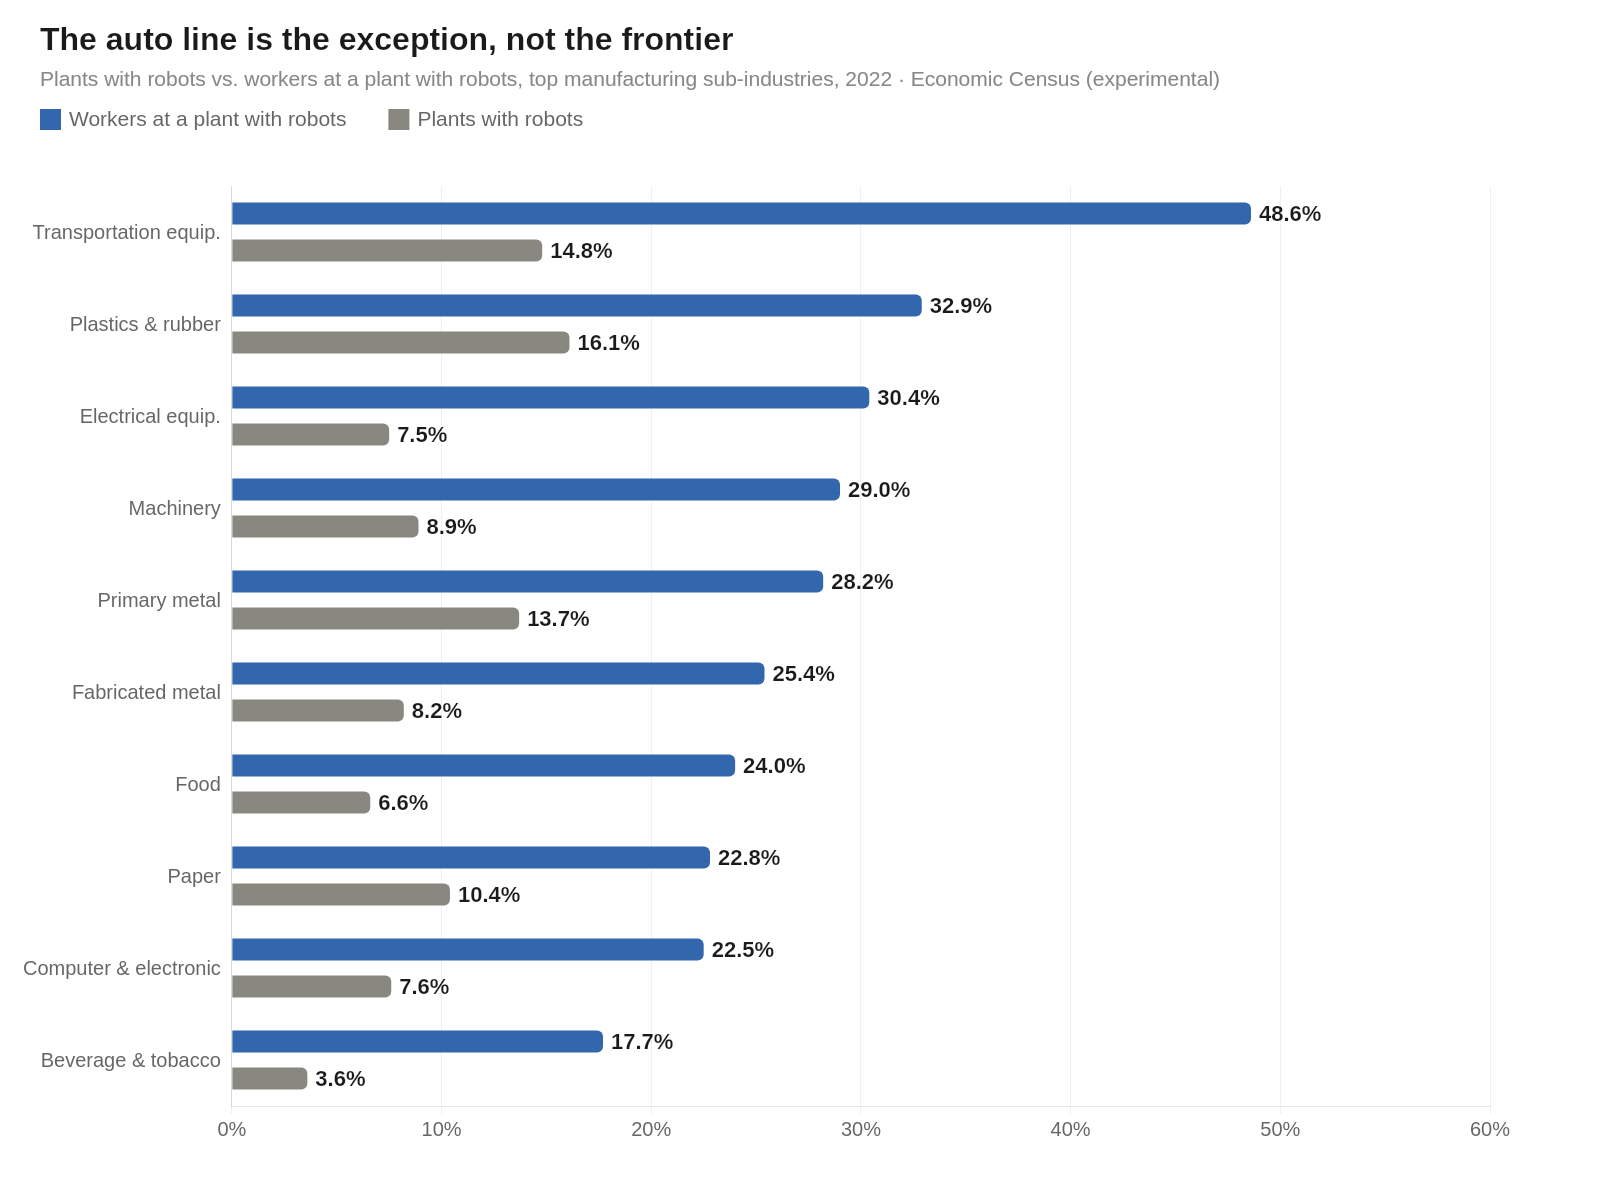
In every sector, more of the workforce stands near a robot than the plant count alone would suggest, because robots live in the bigger plants of each industry. Transportation equipment is a different order of thing. Fifteen percent of its plants have robots, and forty-nine percent of its workers are at one—a gap half again as wide as the next sector’s. Nearly half of everyone who builds a vehicle in America already shares a floor with a robot. Plastics and electrical equipment follow at a distance; printing and apparel barely register. It is tempting to read the auto line as the leading edge, the place the rest of manufacturing is headed. The rest of the data reads the other way. Autos are the one sector where the volumes run high enough and the parts stay uniform enough that the integration cost amortizes cleanly. The exception that shows how hard the crossing is everywhere else.
So here is what the two surveys, between them, tell anyone drafting robotics policy. The barrier to American robotics was never just the sticker price of the hardware, and it was never a national allergy to machines. The software numbers should put both to rest. A robot returns nothing until it has been fitted to one particular place, and only the firms and plants large enough to swallow that fitting cost are doing the fitting. The adoption we have is concentrated by size, sector, and geography, and all three concentrations trace to the same threshold.
Which is why the reflex policy misfires. Cheaper hardware, a tariff on someone else’s arms, both aim at a cost that was never the sole obstacle. If the goal is more robots on more American floors, and more different American floors, you do not just buy down the arm. You buy down the three weeks with the integrator, and the risk carried by the plant that goes first. Bring the fitting cost within reach of a two-hundred-person shop and the wall starts to come down. Leave it where it stands, and robotics stays what both of these surveys already show it to be: a technology for the operations big enough to afford the part that is not the robot.
Among firms reporting a technology as applicable—the applicable-but-not-used, tested-but-not-used, and used responses summed, excluding “not applicable” and “don't know”—the share reporting production use. Robotics: 0.8 / 4.1 ≈ 19 percent at firms with 1–4 employees, 21.5 / 27.3 ≈ 79 percent at 25,000 or more. Software: 28.1 / 36.1 ≈ 78 percent and 50.6 / 55.0 ≈ 92 percent. ABS Tables 79 and 81. The three largest size bands rest on small counts (894, 692, and 362 firms) with several cells carrying relative standard errors above 50 percent; read the shape, not any single point.